Appearance
Vue3 + Vite 使用 D3.js 的记录
1. 安装 D3.js
npm v9.6.7
node.js v18.17.0
vue v3.3.10
安装阶段出现了依赖不完整问题:使用 pnpm 或 cnpm 时,部分子包未被完整拉取。其中 d3-contour 依赖在部分安装方式下可能缺失,改用 npm 重新安装后可恢复完整依赖。
javascript
import * as d3 from 'd3';
import 'd3-contour';
引入相关依赖:
html
<div ref="svgContainerRef"></div>用于承载生成的 SVG:
js
const drawContour = function () {
  const n = data.width;
  const m = data.height;
  const width = 928;
  const height = Math.round(m / n * width);
  const path = d3.geoPath().projection(d3.geoIdentity().scale(width / n));
  const contours = d3.contours().size([n, m]);
  const color = d3.scaleSequential(d3.interpolateTurbo).domain(d3.extent(data.values)).nice();

  const svg = d3.create("svg")
    .attr("width", width)
    .attr("height", height)
    .attr("viewBox", [0, 0, width, height])
    .attr("style", "max-width: 100%; height: auto;");

  svg.append("g")
    .attr("stroke", "black")
    .selectAll()
    .data(color.ticks(20))
    .join("path")
    .attr("d", d => path(contours.contour(data.values, d)))
    .attr("fill", color);

  return svg.node();
}
生成结果:
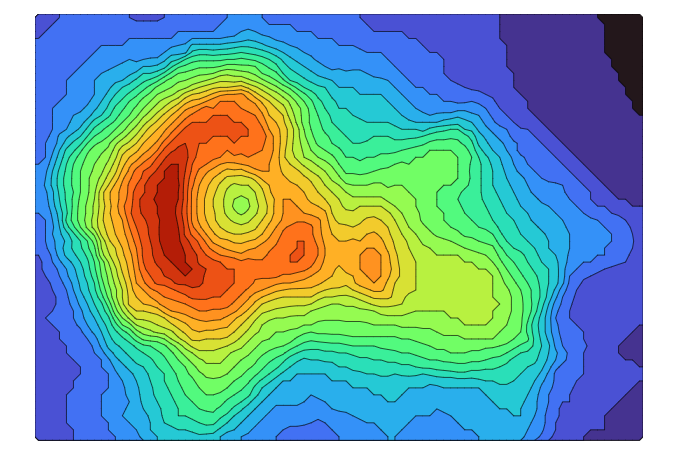
D3.js 直接操作 SVG 的 API 粒度较低,等值线图的颜色映射和图例通常需要手动处理。对于这类统计图表场景,Plot 这类更高层的封装更适合快速完成默认配置。
改用 Plot 生成。
2. Plot
2.1 Plot
官方示例界面: 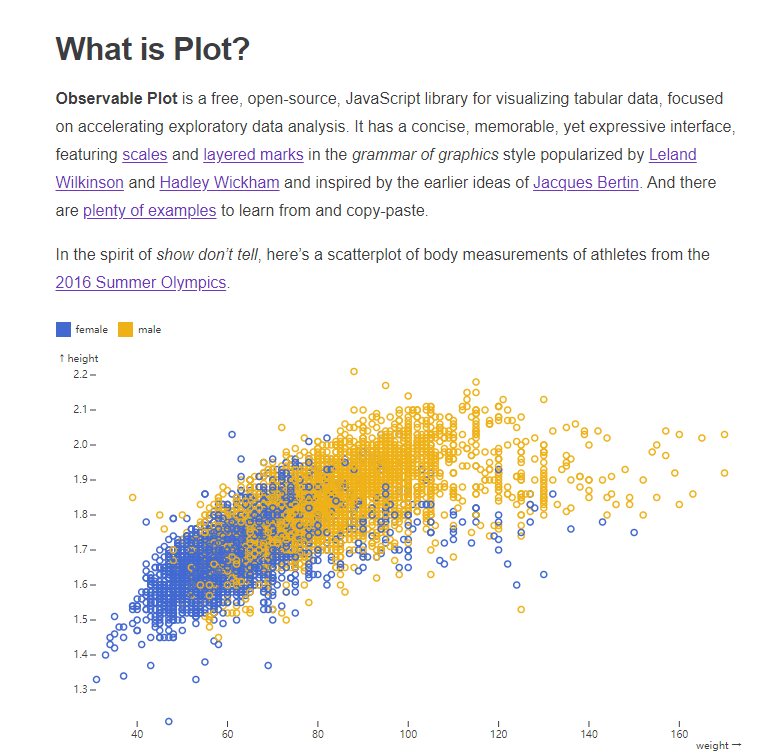
Plot 是 D3 团队基于 D3.js 提供的高层绘图库。
安装 Plot:
bash
npm install @observablehq/plotjs
import * as Plot from "@observablehq/plot"引入依赖:
html
<div ref="controlRef"></div>用于放置图形的容器:
js
const setcontrol = function () {
  const plotDom = Plot.plot({
    color: {
      legend: true,
      label: "Elevation (m)"
    },
    marks: [
      Plot.contour(data.values, {
        width: data.width,
        height: data.height,
        fill: Plot.identity,
        stroke: "black"
      })
    ]
  })
  controlRef.value?.appendChild(plotDom);
}
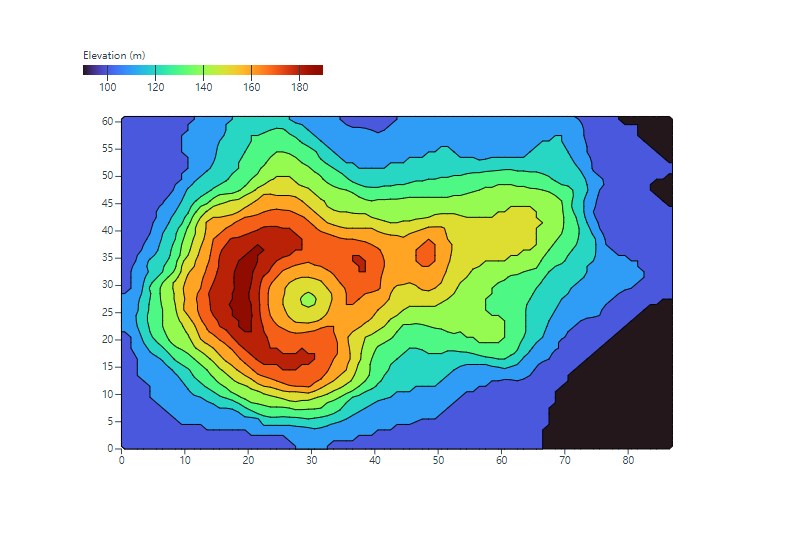
Plot 的默认配置在颜色映射、图例位置和等值线间隔上已经覆盖了大多数统计图表场景。对于不需要自定义底层绘制流程的页面,Plot 的接入成本更低。
生成结果: